PE‑Backed 3PL Roll‑Up IT Integration
Full operational synergy delivered 3 months ahead of schedule. Led by iO consulting — Igor Osipov.
Executive Summary
Company names are anonymized under NDA. A US-based platform 3PL merged with two regional 3PLs (UK + EU) under a PE-funded program. The integration consolidated a fragmented “zoo” of processes and applications into a single operating model and a unified core stack—WMS / CRM / BI / EDI / Quote Management—with targeted Cloud + AI improvements designed to move EBITDA, cash conversion, and scalable growth capacity.
This program was run as a value creation plan that supports the deal thesis from pre‑diligence through exit (not a standalone “systems project”). It was managed with a cadence of check-ins and performance reviews consistent with how Operating Partners drive process optimisation across supply chain and sales execution.
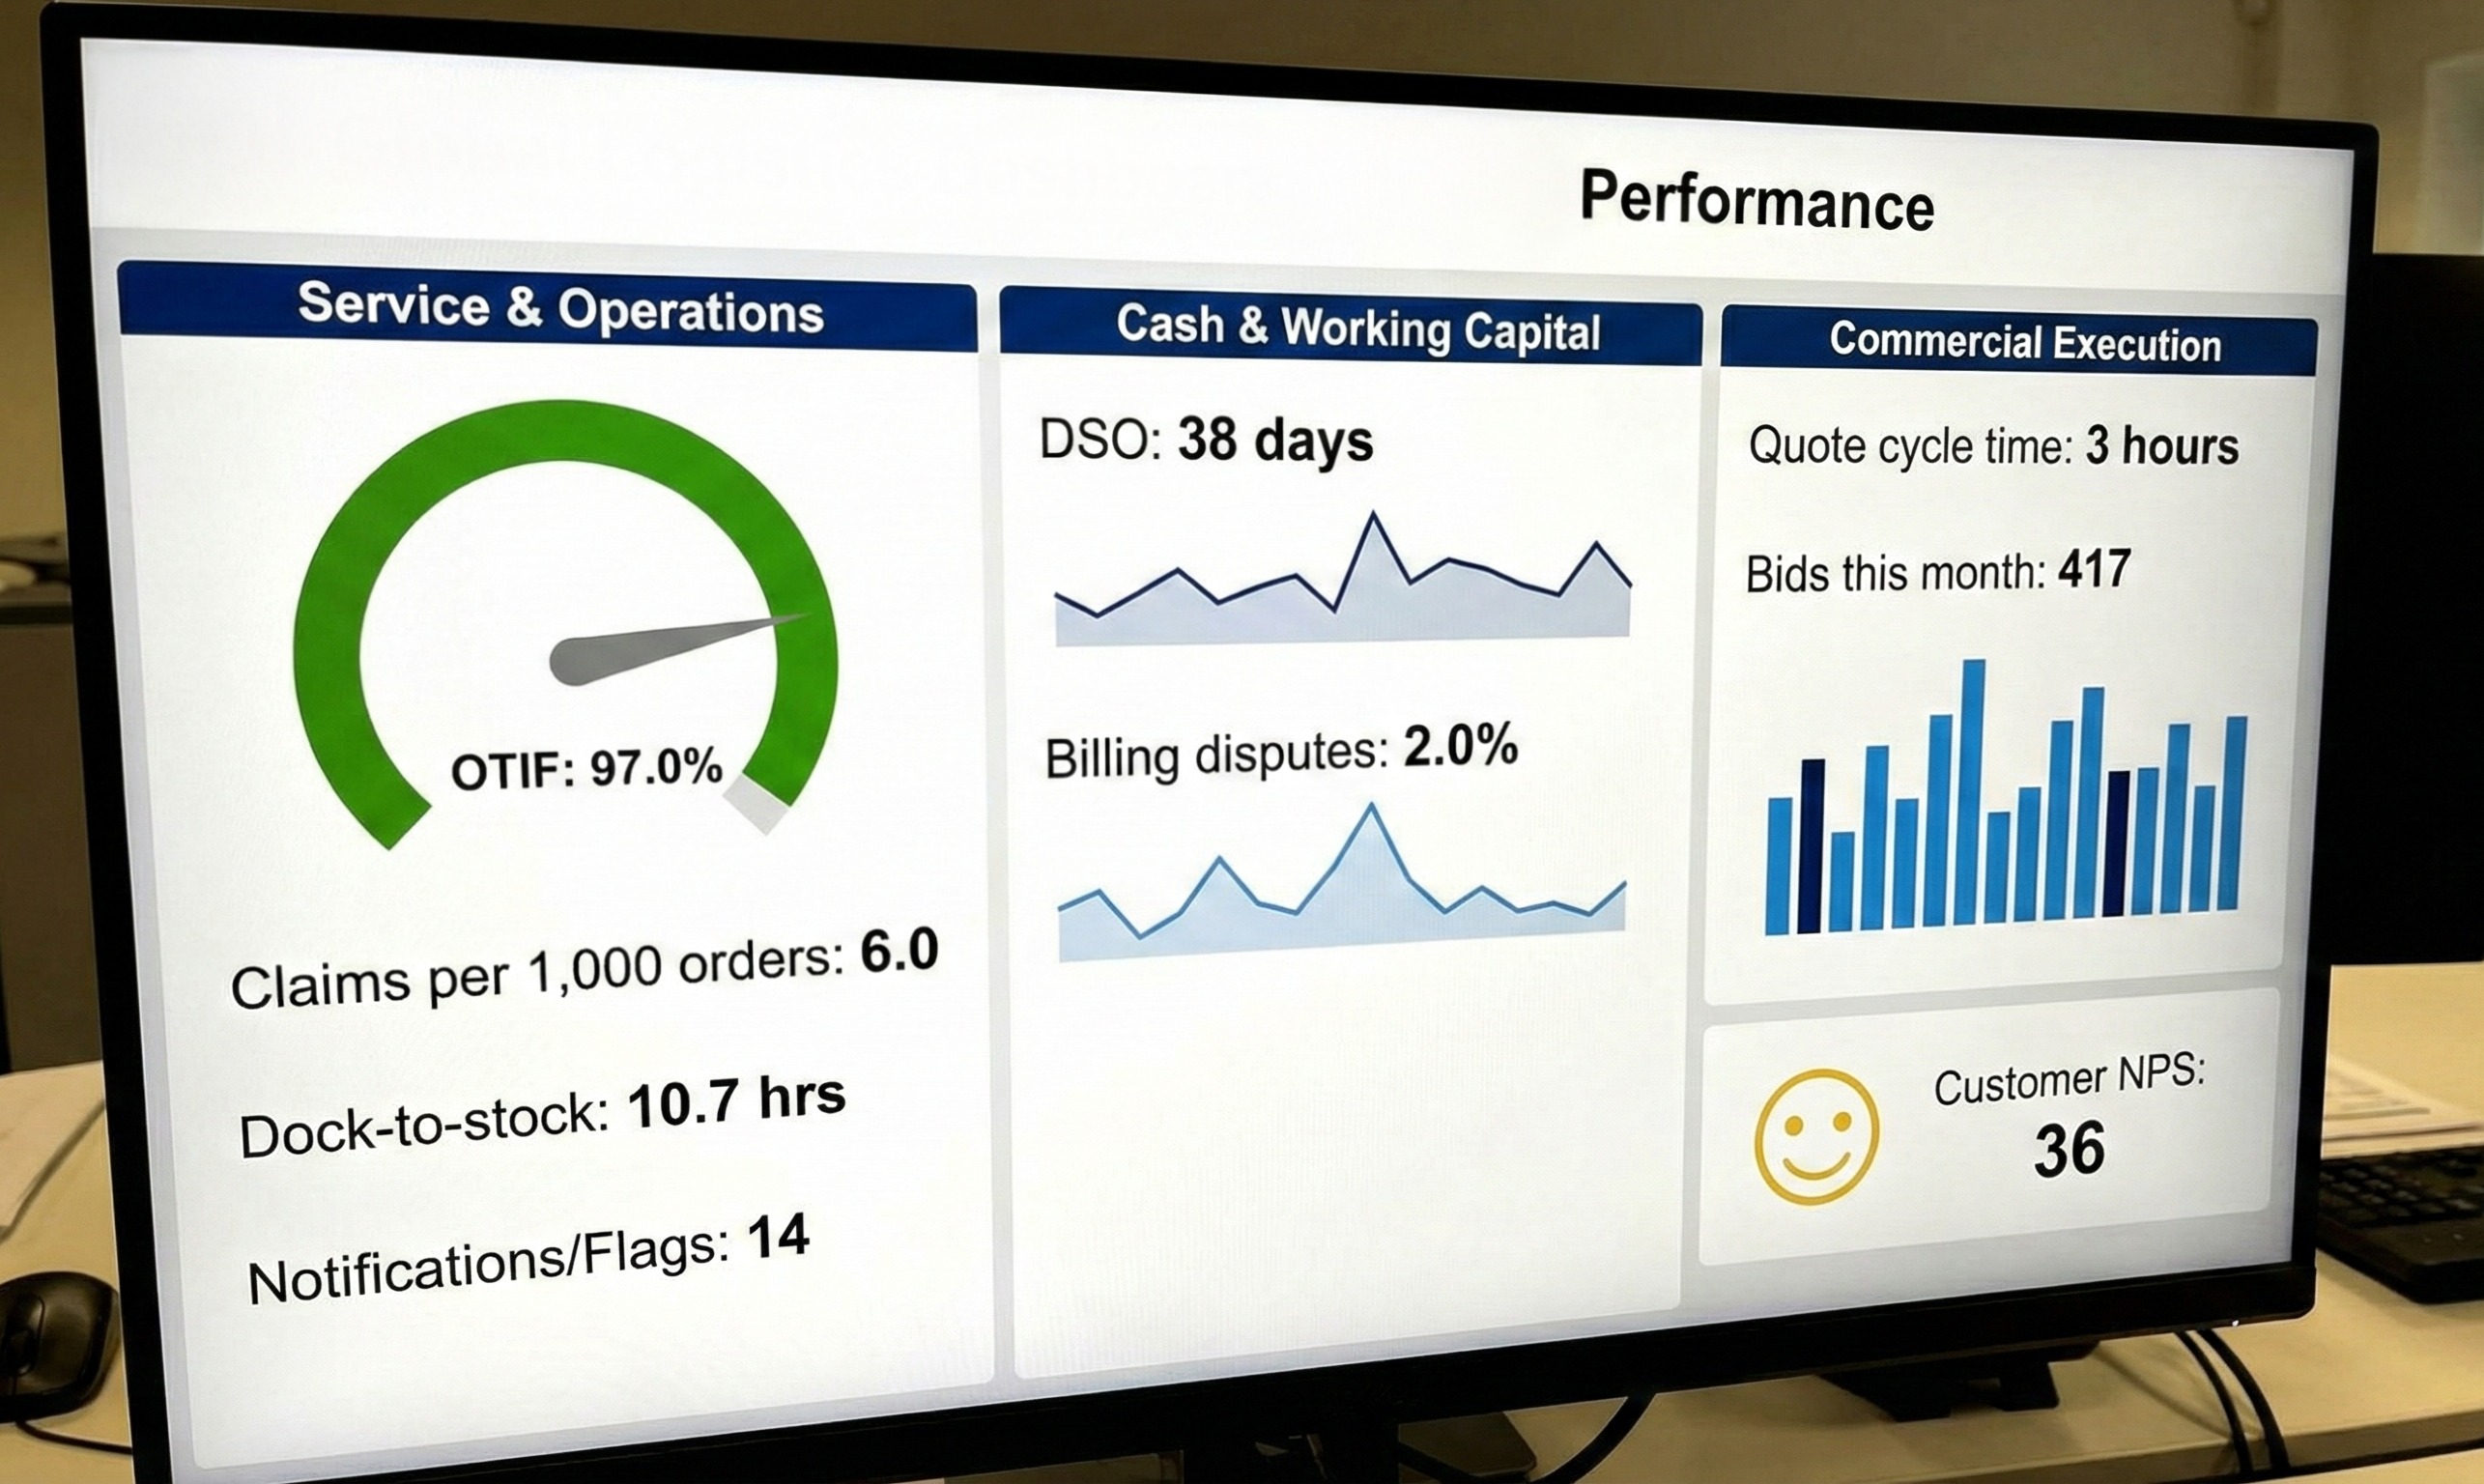
Board-Ready Outcomes (Value Creation Metrics)
Profitability & cost
| Contribution margin uplift | +120 bps |
| SG&A improvement | 32% |
| Cost-to-serve reduction | 12% |
| Invoice accuracy | 99.3% (from 90.1%) |
Service & operations
| OTIF | 97.0% (pre‑program: untracked; estimated ~80%) |
| Claims per 1,000 orders | 14.8 → 6.1 |
| Dock-to-stock cycle time | 19.5 hrs → 11.2 hrs |
| Proactive exception notifications adoption | 0% → 98% |
Cash & working capital
| DSO | 38 days (pre‑program: unclear; 100+ days) |
| Billing dispute rate | 8.4% → 2.0% |
Commercial execution
| Quote cycle time | up to 30 days → 3 hours |
| Win rate | +55% relative improvement |
| Bid capacity | 420 quotes per month (from 60/month) |
| Pipeline hygiene | forecast accuracy ±6% at 8-week horizon (from ±22%) |
Reporting & control
| Month-end performance reporting cycle | 10 business days → 3 business days |
| Customer NPS | 21 → 36 |
The Situation
A multi-country roll-up created three predictable integration blockers:
- Inconsistent operating processes by site/region (quote-to-order, exception handling, billing, customer communications).
- Unreliable measurement (OTIF untracked; DSO unclear; inconsistent KPI definitions).
- Fragmented core systems across functions—WMS/CRM/BI/EDI/quoting—driving rework, leakage, and slow decision cycles.
The Challenge for Operating Partners
For Operating Partners, this is exactly where speed matters: diagnosing performance issues, unlocking working capital, and arresting margin erosion under tight timelines.
What Was Integrated
WMS
Standardised operational events, exception codes, and KPI instrumentation to make OTIF measurable and improvable across sites.
CRM
Unified pipeline definitions, lead routing, and opportunity stages so sales execution could scale across US/UK/EU.
Quote Management
Structured deal inputs, templates, approvals, and completeness checks—turning quoting into a repeatable revenue engine.
EDI
Normalized partner mappings and exception handling to reduce operational noise, improve service reliability, and prevent downstream billing issues.
BI
A single “definition layer” for margin, OTIF, productivity, pipeline, and DSO—so the board and operators see one truth.
What Changed
Before
- Quoting was manual, inconsistent, and often missing critical inputs; cycle time could reach 30 days.
- OTIF was not reliably tracked; service issues were managed reactively.
- Billing was fragmented and exception-heavy; DSO regularly exceeded 100 days.
- KPI definitions varied by region; reporting lagged operations.
After
- Quote cycle time compressed to ~3 hours, enabling high bid volume and fast responsiveness.
- OTIF instrumented and managed to 97% via exception-driven workflows.
- Billing consolidated; invoicing automated; exceptions flagged early—driving DSO to 38 days.
- BI unified with board-ready reporting and an operator cadence that closes the loop from metric → action.
Operating Partners are expected to create value in operating companies and are typically measured on improvements to performance, cost, and working capital. This program aligned directly to that mandate: it implemented the measurement framework and the proof points needed for later buyer diligence and exit readiness. It also provided the dashboards and operating rhythm that let PE teams stay close to the facts without micromanaging.
Governance Model (How the Program Stayed PE-Paced)
Cadence
- Daily: operational exceptions triage (service, EDI failures, billing holds, hot accounts)
- Weekly: KPI review (OTIF, margin leakage, DSO, pipeline, quote SLAs), with owners and due dates
- Monthly: board-ready value creation review (synergy scorecard + proof points)
Controls
- Single KPI dictionary and definition layer in BI
- Dependency map across workstreams (ops, commercial, finance, IT)
- Cutover runbooks and rollback criteria
- Risk register tracked to closure
Operating Partners increasingly support portcos through the value creation plan from pre-diligence through exit, so this structure was designed to remain “exit-usable” rather than a temporary project artifact.
Why PE Operating Partners use iO consulting for logistics roll-ups
Speed with control
Fast integration without destabilizing service levels (OTIF, billing, customer comms).
Value-first sequencing
Margin + cash + growth capacity move early, not “after the migration.”
Operator adoption
Workflows that frontline teams can run, not slideware.
Repeatability
A roll-up playbook that compounds across add-on acquisitions.